Introducing Nafas Insights
Hi, nafas users! Good news for you!
It’s been two years since we installed 170+ air quality monitoring sensors in Indonesia. Nafas always strives to provide air quality information to help you live a healthier life. We, therefore, present you Nafas Insights, a past 7-day brief summary of air quality in your location.
p.s. this feature is only available to registered users and app updaters. If you haven't updated it yet, just click here and register yourself!
Well, now you’ve updated this app. Let's get to know more about Nafas Insights!
What is Nafas Insights?
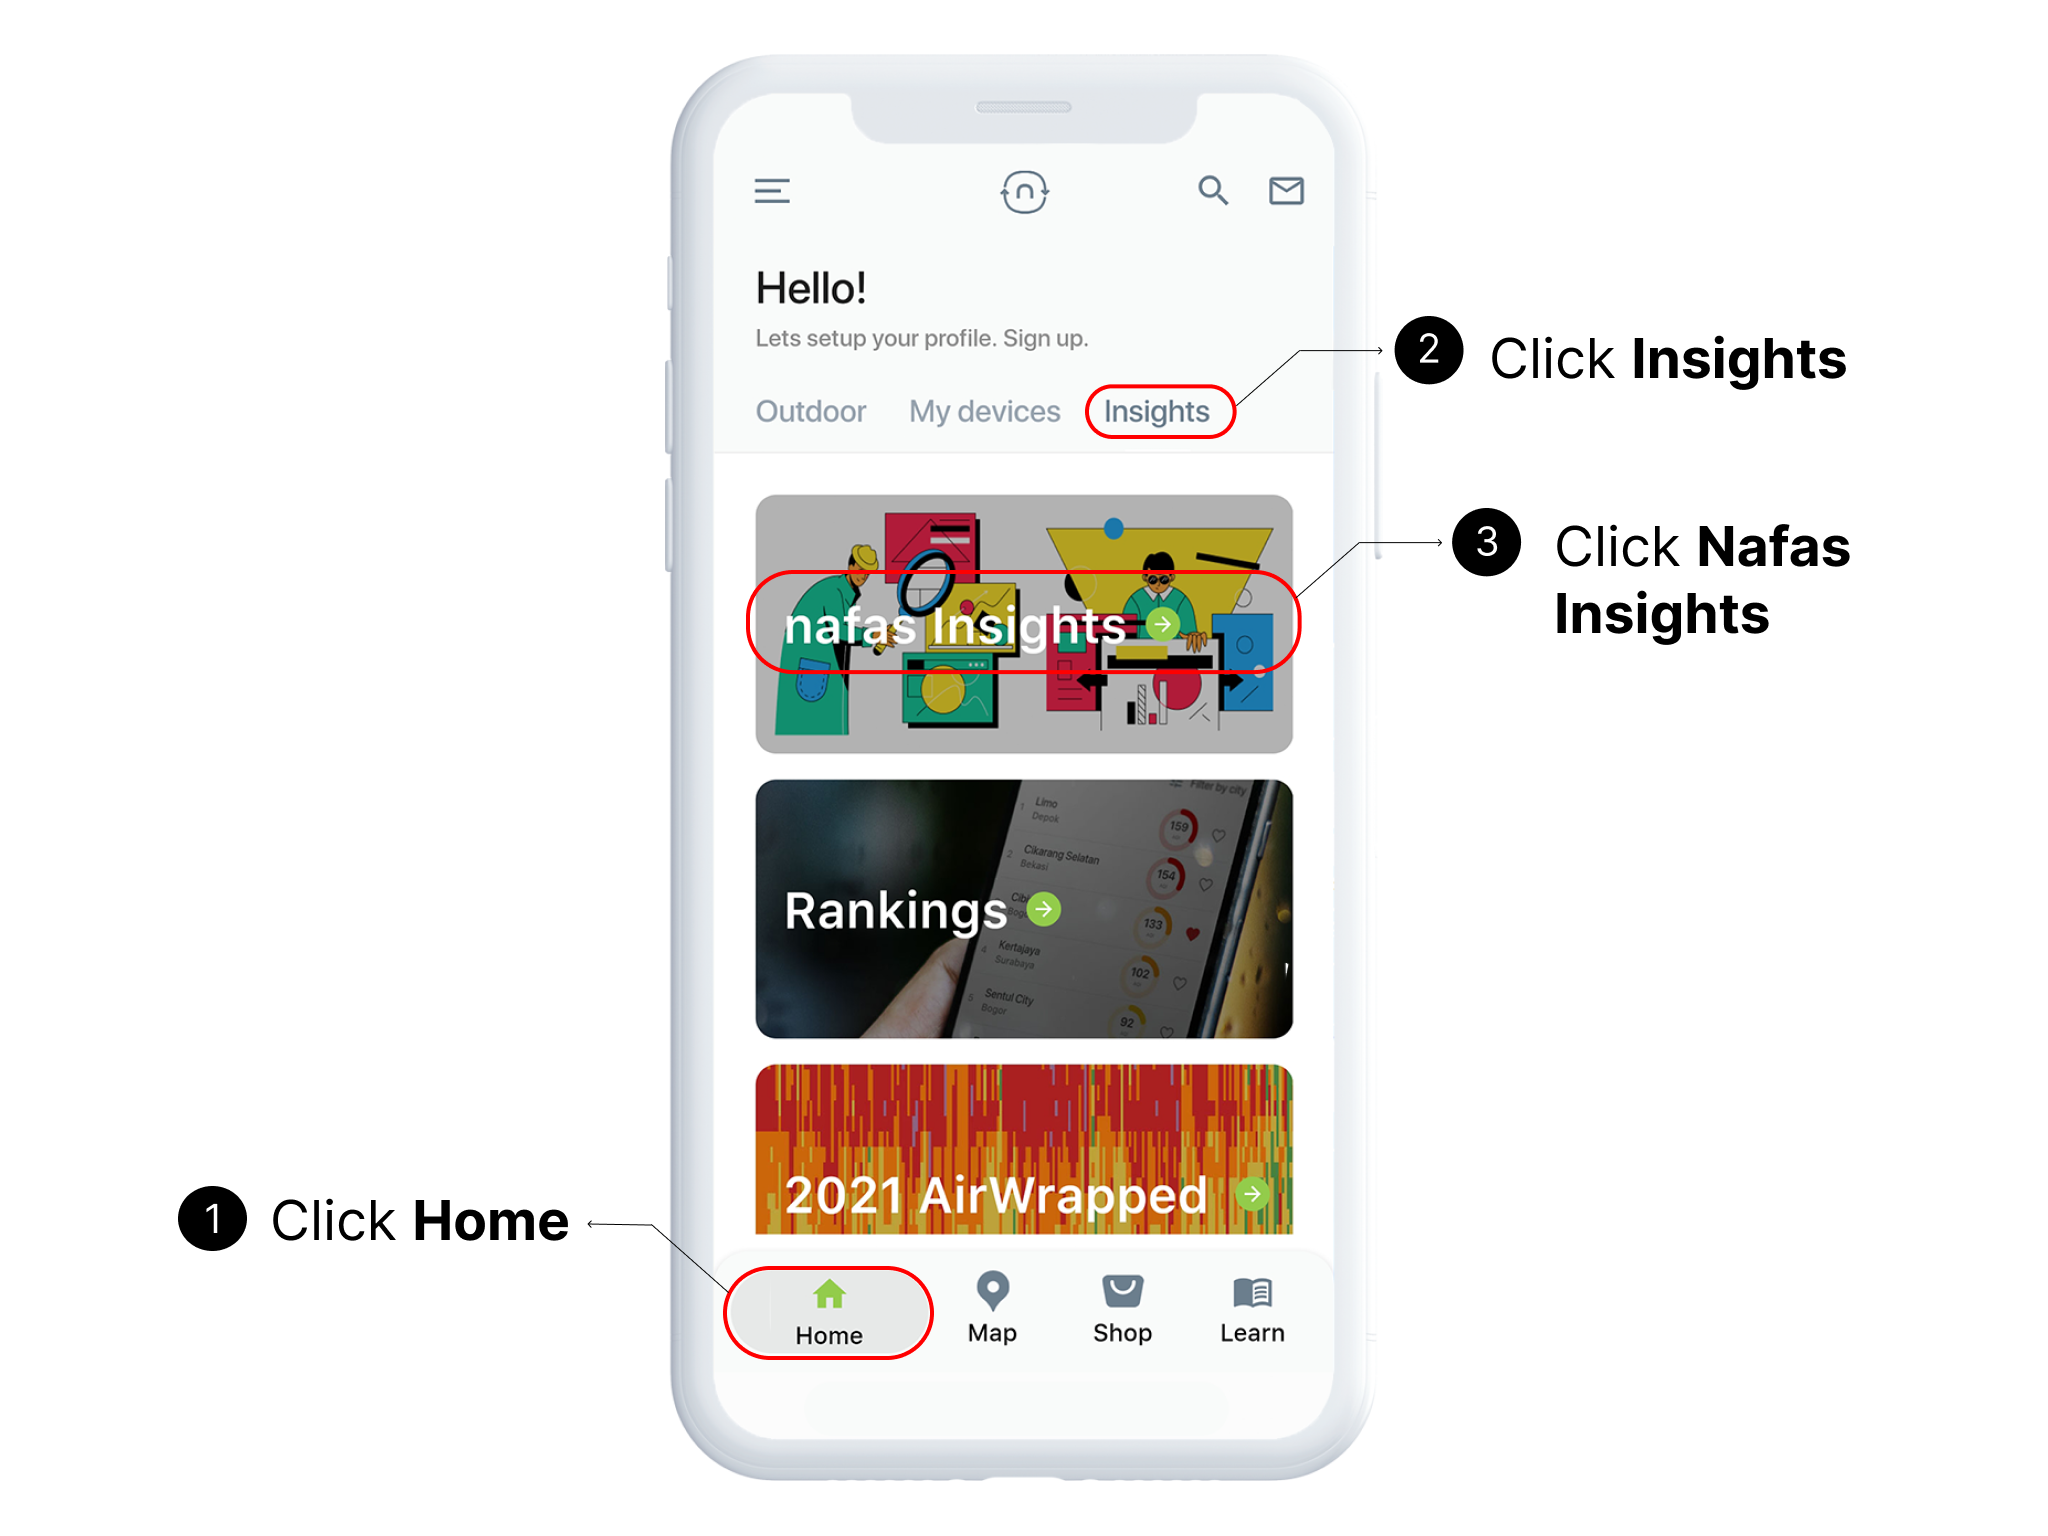
Nafas Insights is a brief summary of the air quality in your location in the last 7 days. To begin, select your preferred location by clicking the Choose Home Location on the home page. To explore your Nafas Insights, you can access it via the Home page > Insights > Nafas Insights.
…. and discover these intriguing features only in Nafas Insights!
#1 Weekly Highlights
First, you'll notice the average PM2.5 level in your area over the last 7 days. This feature provides information on the average air pollution level per day based on the Air Quality Index. Daily air pollution is also displayed as a bar chart from Monday to Saturday.
#2 WHO Difference
This feature helps you know how healthy the air quality you breathe during the week. WHO set the limit for PM2.5 in the air is 5 μg/m3. This will show you the difference between PM2.5 in your area and the PM2.5 recommended by WHO.

#3 Change in PM2.5
If you are curious enough about the air quality trend in your location, nafas will kindly answer that! This feature shows a change in PM2.5 compared to last week. Keep in mind that the red up arrow indicates an increase in PM2.5 compared to last week, while the green one indicates a decrease in PM2.5. Hopefully, this sign is always green in your location!

#4 Indoor vs Outdoor
Even if you haven't left the house in the last 7 days, you can estimate the air quality in the room. This feature will show you the estimated average indoor PM2.5 level based on the outdoor PM2.5.
#5 Cigarette Equivalence
This feature compares average PM2.5 levels to the cigarettes smoked, where a Chinese study states that breathing 22 μg/m3 is equivalent to smoking 1 cigarette.

#6 Location Ranking
The location ranking feature shows the order of locations from best to worst air quality. If your location is in the 1st rank, it is pretty clear that your location's air quality is the healthiest compared to other areas!
#7 Best and Worst Time
Last but not least, we display the time with the healthiest average air quality and the time with the worst average air quality over the past 7 days. You'll gain new insight into how good or bad the air quality is at specific times of the day.
Once more, if you haven't updated the app to the latest versions, do so now and get the insights!